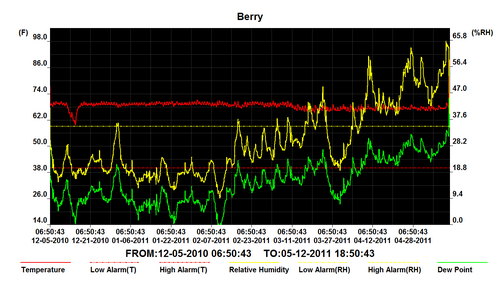
Here is a humidity graph for 3 months. This was on the piano in the choir room at my church. Notice the red line that shows a nice even temperature. This is where people say “We keep the room very constant.” But look at what happens to humidity over time. No wonder pianos go out of tune.

